A PageSpeed audit is not a vanity score for social media — it is how you measure how fast and stable your site feels, read the report, and decide what to optimize first. If you only chase green or red numbers without context, you will change hosts or install plugins at random.
This guide is practical — focused on PageSpeed Insights, Lighthouse, and Google’s field data — and fits as the performance chapter inside a broader technical SEO audit. You can also run our SEO audit checklist for developers as an actionable list. It does not replace indexing or link checks; it complements the Core Web Vitals step.
Table of contents
- What a PageSpeed audit is
- PageSpeed vs a full SEO audit
- Tools you will use
- Lab data vs field data
- Audit steps (workflow)
- Reading LCP, INP, and CLS in the report
- What to fix first
- Common mistakes
- FAQ
What a PageSpeed audit is
It is a diagnosis focused on perceived performance and experience metrics: how long until main content is visible (LCP), how responsive interactions feel (INP), and how stable the layout is (CLS). Google surfaces much of this in PageSpeed Insights and Search Console under Core Web Vitals.
The goal is not “getting 100” in Lighthouse, but to:
- Spot problematic templates (home, categories, product detail, key landings).
- Separate server, frontend, image, and third-party issues.
- Prioritize changes that help real users and, as a side effect, SEO.
If the acronyms are still fuzzy, read Core Web Vitals explained: what to measure and why SEO cares before going deeper.
PageSpeed vs a full SEO audit
| PageSpeed audit | Full technical SEO audit |
|---|---|
| Speed, CWV, render-blocking resources, page weight | Indexing, canonicals, sitemap, architecture, schema, links |
| Hours to a few days per key template | Days to weeks depending on site size |
| Great after redesigns, bounce spikes, or before paid campaigns | Essential before migrations and before scaling content or link building |
You can run a PageSpeed audit alone when mobile traffic drops or Search Console flags URLs in red under Experience. If you also have mass “Discovered — not indexed”, fix crawl access first with our technical SEO audit step by step before obsessing over the Lighthouse score.
If you need a budget for implementation or a monthly retainer after measuring speed, see technical SEO pricing for indicative ranges and what a serious quote should include.
Tools you will use
- PageSpeed Insights (PSI): public URL, blends field data (CrUX when available) and lab Lighthouse.
- Lighthouse in Chrome DevTools: repeatable locally or on staging; ideal for before/after deploys.
- Google Search Console: Core Web Vitals report by URL groups — aggregated Chrome user data.
- WebPageTest or similar (optional): detailed waterfall, locations, and throttled connections.
For day-to-day dev work, pair PSI with our SEO DevTools for developers guide — Network, Coverage, and Performance tabs fill in what PSI summarizes.
Lab data vs field data
Lab: controlled simulation (device, network, test location). Repeatable. Best for debugging after a deploy.
Field: anonymized real-user measurements (Chrome User Experience Report). Reflects actual devices, networks, and caches. Search Console uses field data to label URLs good / needs improvement / poor.
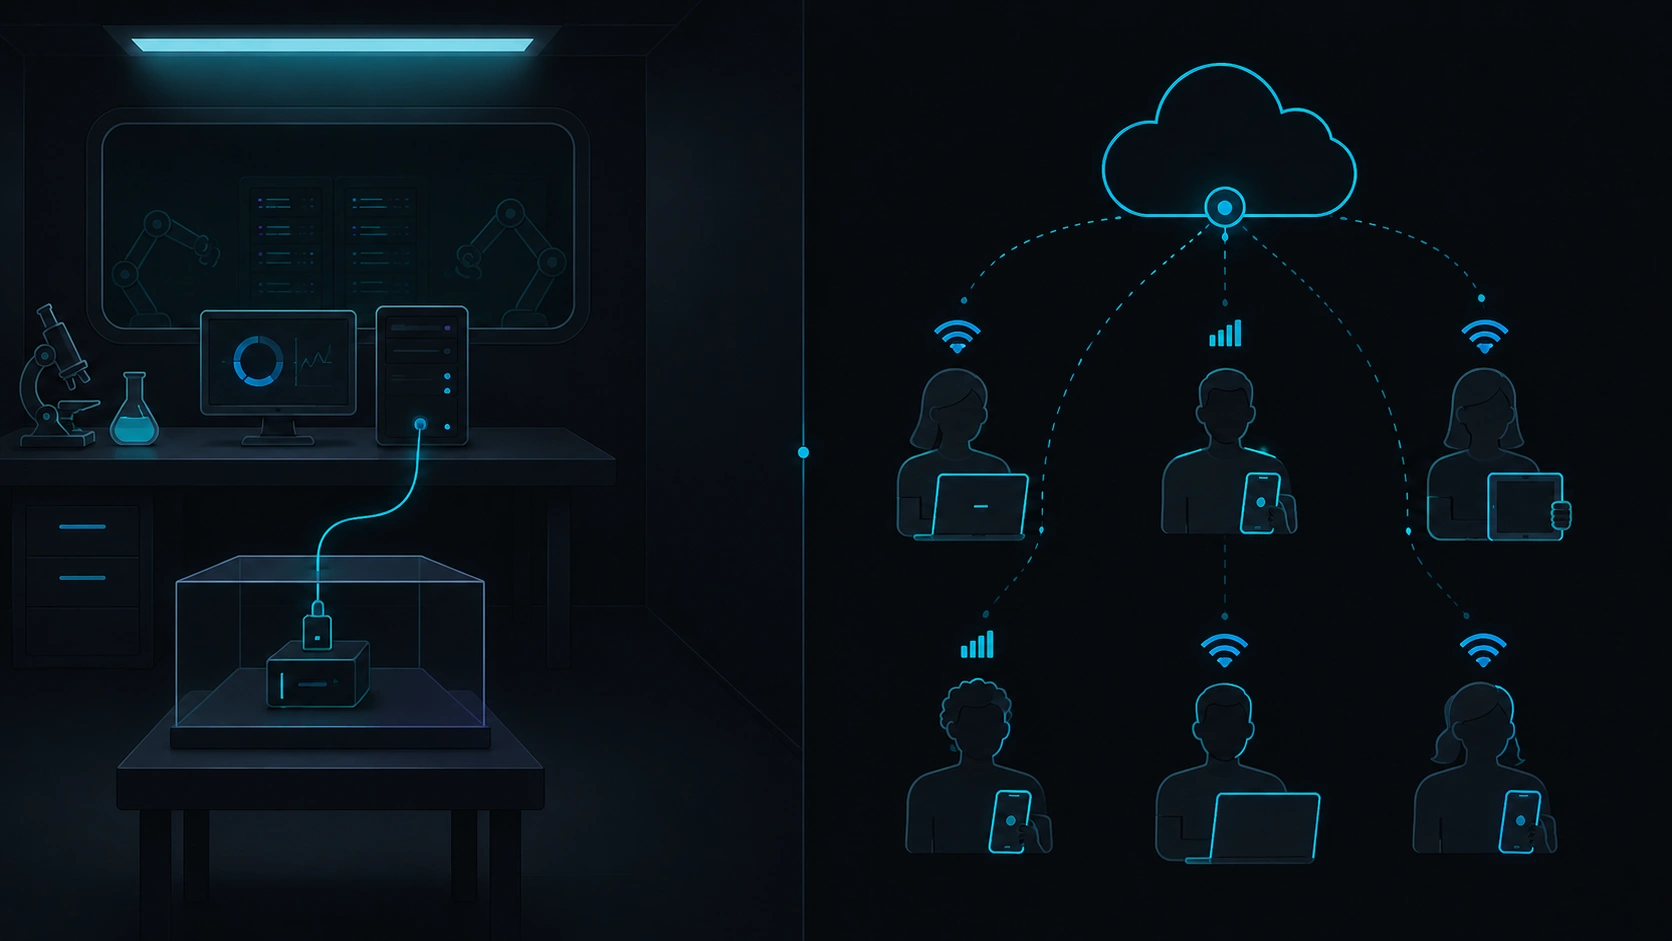
Practical rule: do not celebrate a 98 Lighthouse score if Search Console still shows poor LCP on the same template. Re-test on mobile, throttled 4G, and the exact URL that ranks.
Audit steps (workflow)
- Pick 5–10 URLs: home, main landing, a traffic blog post, a listing template, and one URL you already know is slow.
- Pick the device: start with mobile; desktop only if your business is overwhelmingly desktop B2B.
- Run PSI on each URL; screenshot or export top opportunities. As a shortcut, test your domain first in the PageSpeed simulator on our technical SEO landing.
- Note the three CWV (field when available; otherwise lab) and the LCP element PSI highlights.
- Group by template: if ten products fail the same way, fix the template — not ten one-off tickets.
- Bucket opportunities: images, JavaScript/CSS, server/network (TTFB, cache, CDN).
- Ship 1–2 high-impact changes; re-measure the same URL under the same conditions.
- Document URL, date, scores/metrics, and what changed — essential when working with agencies or external devs.
Reading LCP, INP, and CLS in the report
If you need a refresher on what each metric means and Google’s thresholds, revisit Core Web Vitals explained: what to measure before diving into PSI opportunities.
LCP (loading)
PSI shows which element was “largest contentful” (hero, image, text block). Ask: oversized image? slider? slow server response? Opportunities like “Improve image delivery” or “Reduce initial server response time” often point here.
INP (interactivity)
Matters for menus, filters, carts, and SPAs. If INP fails with little visible JavaScript, suspect third-party scripts (chat, tags, A/B tools) blocking the main thread.
CLS (visual stability)
Look for unsized images, late-injected banners, and fonts that shift layout. PSI sometimes lists “elements causing largest layout shifts.”
Lighthouse also scores Accessibility, Best Practices, and SEO categories. For a business-focused PageSpeed audit, Performance + CWV come first; the rest helps but does not replace fixing LCP on the landing that converts.
What to fix first
| Signal | Typical actions (stack-agnostic) |
|---|---|
| High TTFB | HTML caching, CDN, hosting closer to users, less work at origin |
| LCP = hero image | Compression, responsive sizing, careful preload, avoid heavy above-the-fold carousels |
| Blocking JS | Defer non-critical scripts, split bundles, audit plugins injecting global scripts |
| CLS | Reserve space for media and ads; avoid inserting bars over main content |
| INP | Lighten heavy handlers, optimize listeners, limit third-party widgets on key pages |
Suggested order for most corporate sites and blogs: server/cache → LCP images → third-party scripts → CLS → INP polish. E-commerce and marketplaces sometimes swap INP and LCP priority because of cart complexity. Once prioritized, validate impact with Veloce Devs’ SEO simulator and audit tools before opening dev tickets.
Common mistakes
- Auditing only the homepage while organic traffic lands on slow blog posts or categories.
- Optimizing desktop while Google evaluates mobile-first.
- Treating Lighthouse score as a ranking switch — it helps, but it is not a direct dial.
- Installing a “PageSpeed plugin” that minifies blindly — often hurts INP or breaks features.
- Not re-testing after changes, or testing under different conditions (network, browser extensions).
- Ignoring field data when Search Console already has enough volume.
FAQ
How long does a basic PageSpeed audit take?
For 5–10 URLs and a prioritized write-up, budget half a day of analysis plus another half day if you include dev meetings. Implementation depends on your team — hours to several weeks.
Is PageSpeed Insights free?
Yes. Lighthouse in Chrome is free too. Search Console is free with domain verification. Advanced waterfall tools may be paid but are not required to start.
What PageSpeed score do I need to rank?
There is no single public threshold. Google works with Core Web Vitals ranges and broader experience signals. Aim for “good” in the field on main templates, not a round lab number.
PageSpeed audit on staging or production only?
Production reflects CDN, real cache, and third parties. Staging helps validate fixes before release, but always re-check the public URL after deploy.
How often should I repeat it?
After major design, plugin, or script changes. In steady state, monthly or quarterly checks on the same “canary” URLs plus Search Console’s CWV report.
Want to test a URL before opening the full report?
On Veloce Devs’ SEO landing you can run a PageSpeed audit on your domain and see key metrics in one flow — a solid first step from this guide.
Leave a Reply